Exploring GTFS static and realtime data in public transport planning
Originally developed by Google in 2005 to power its Maps and Transit services, the General Transit Feed Specification – known as GTFS – offers a structured and uniform method for public transit agencies to publish their schedules, routes, and geographic information. This standardised format serves as the backbone of modern transit data management, enabling seamless integration and accessibility for third-party developers and transport planning professionals.
Today, GTFS encompasses two main categories: static, which is the original and often simply referred to as GTFS, and realtime, an extension of the original GTFS.
GTFS Static delivers a snapshot of transit schedules and routes, serving as an essential resource for planning and analysis. In contrast, GTFS Realtime uses GPS technology on buses to provide dynamic updates on vehicle locations, offering transit users and operators up-to-the-minute information essential for efficient travel planning and operations. Together, these two components enable you to see how delayed your bus is by using location data and travel time estimation algorithms.
At VTM, we have extensive experience in obtaining and processing both static and realtime GTFS. While the former serves as a powerful baseline for our studies, the latter allows us to gain a deeper understanding of the actual conditions on the streets.
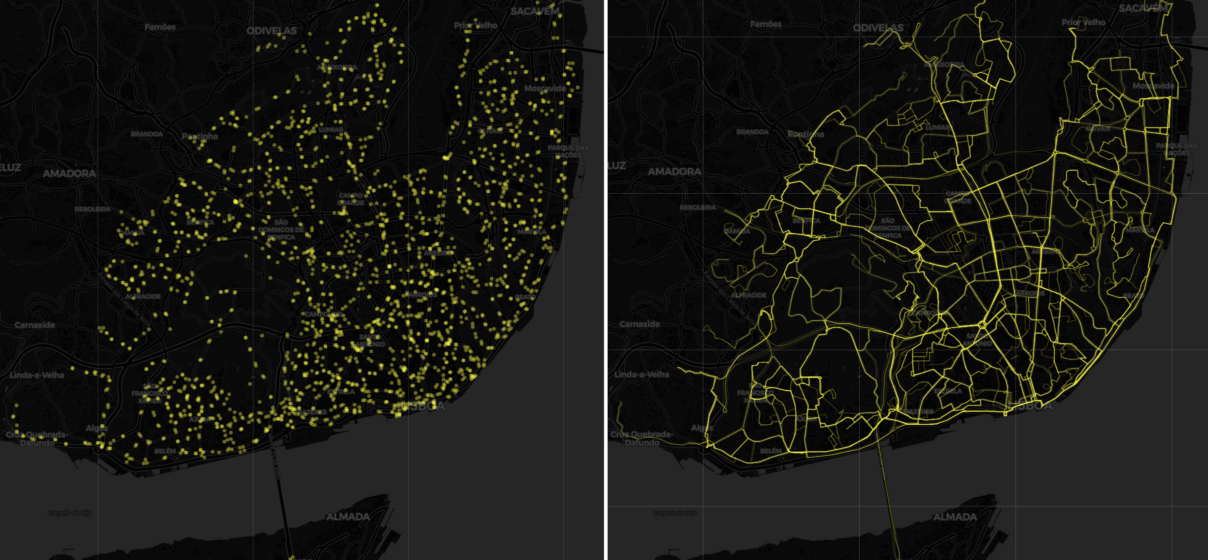
With GTFS Static, we can effectively visualise bus lines and their frequencies using an interactive heatmap, which we generate with Python and its libraries. Additionally, service frequency variations throughout the day can be examined, and key operational metrics such as the minimum number of buses required and the total distance travelled can be easily calculated.
Taking it to the next level, by integrating GTFS Static with smart card data, we can identify busiest bus stops. Furthermore, after applying our own OD matrix generator, we can visualise the main desire lines of a bus line or region. But that is topic for another article.
With GTFS Realtime, our analysis leans more towards operational insights. By comparing planned services with actual performance, we can identify key operational metrics such as:
- Commercial speed by line and time of day
- Lines where delays are frequent
- Road segments with the slowest speeds or most frequent delays, relative to planned schedules.
GTFS Realtime data is accessed via an API, which typically transmits information only at the moment of the request. To gather this data over specific timeframes, we have developed a script that collects, stores, and processes the data. This script is deployed on AWS (Amazon Web Services) to run every 10 minutes, leveraging the reliability of cloud computing.
At VTM, we utilise all available data to generate insights that add significant value to our clients. If you wish to understand how we can assist your company or department with these technologies, please contact us to schedule a meeting.
Latest news
All news
VTM welcomes Laísa Braga Kappler
VTM is pleased to announce the addition of Laísa Braga Kappler, further strengthening our capabilities in transport modelling and sustainable mobility analysis. Laísa joins VTM with a strong academic and research background in transport systems. She holds a degree in Civil Engineering, a Master’s in Transport Systems Engineering, and a PhD from Instituto Superior Técnico […]

Co-creating the future of mobility in Alentejo Central
On 12 February, the Palácio de Dom Manuel in Évora hosted a key milestone for sustainable mobility in the Alentejo Central region, with the participatory working sessions of the 2nd-generation Sustainable Urban Mobility Plan (SUMP) promoted by CIMAC – Comunidade Intermunicipal do Alentejo Central. At VTM, we are proud to support CIMAC in the development […]